Shuffle is where Photon gets expensive
Photon accelerates scans and joins. A broadcast hash join on a 20 MB dimension is cheap. A shuffle join on two 2 TB facts whose keys are not clustered is the query that pins a Large warehouse for 12 minutes. DBU-hours follow wall clock.
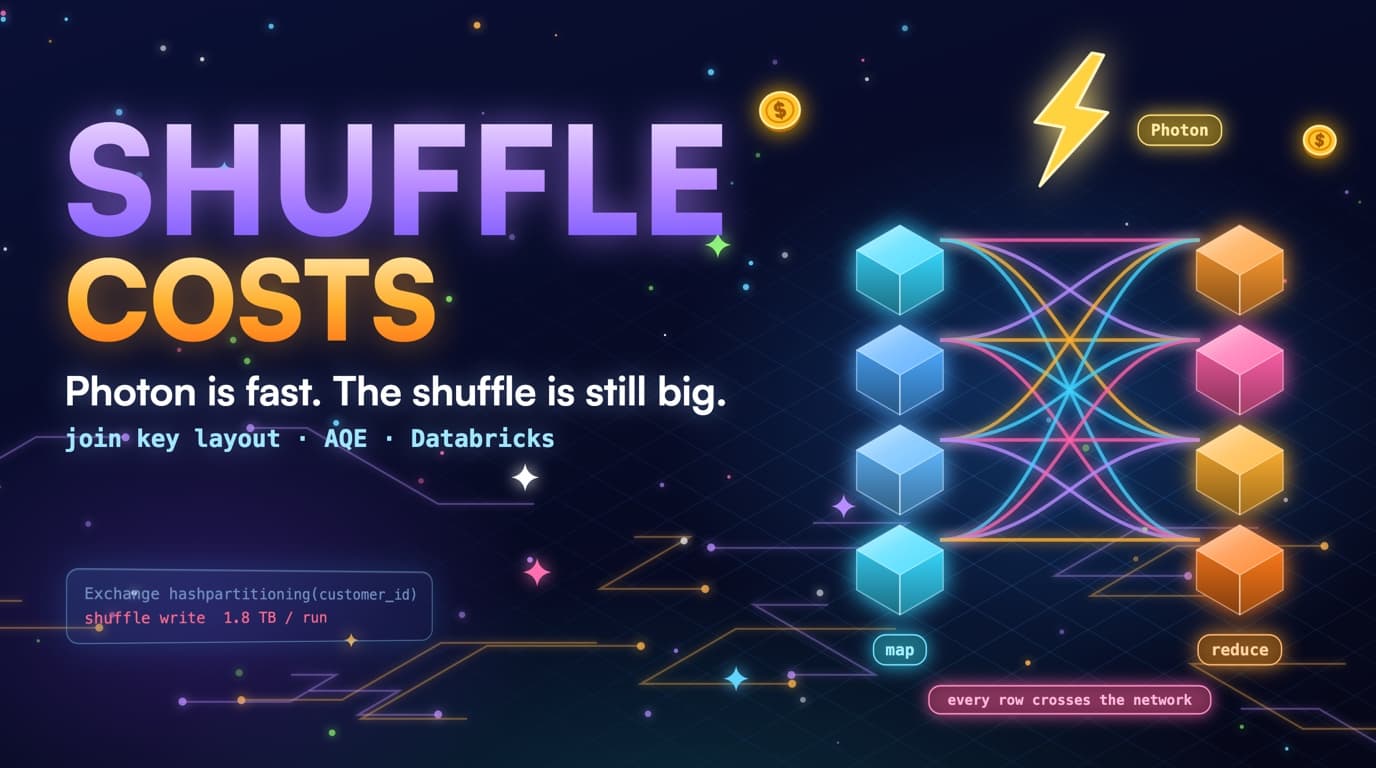
Shuffle is the moment rows change hands across executors so that matching keys land together. It is disk, network, and serialization. Photon makes the CPU part less embarrassing. It does not make 2 TB travel for free. Teams that enable Photon and keep the same unclustered two-fact join have bought a faster shuffle, not a smaller bill.
SELECT o.order_id, c.segment, SUM(o.amount)
FROM analytics.orders o
JOIN analytics.customers c ON o.customer_id = c.customer_id
WHERE DATE(o.event_ts) = CURRENT_DATE();
-- DATE() already forced a full scan.
-- customer_id not clustered → shuffle both sides.
AQE, adaptive query execution, can convert a shuffle join to broadcast if runtime stats say the build side is small, and it can coalesce shuffle partitions. What it cannot do is skip the shuffle when both sides are huge and unsorted on the join key. AQE smooths out edge cases; it does not replace a sensible layout and join shape.
The dashboard that looks simple in Looker is often the shuffle. Explore joins orders to customers to the date dim to a mapping table that someone denormalized wrong. Each join can be a shuffle. Each shuffle can spill. Spill is the shuffle that did not fit in memory and went to local disk. spilled_local_bytes in query.history, when present, is the smell.
Repeated is what makes it a finding. One analyst shuffle in a notebook is tuition. The same explore at 9am, 40 times a day, is a DBU product. Fingerprint the statement, multiply duration by warehouse rate by runs per month, and you have a number a finance partner can hold. Ugly SQL that ran once is not that number.
Photon speeds up CPU, not the bytes moved
A shuffle still moves the same bytes across the network. Photon makes each byte cheaper to process, not fewer bytes to move.
Broadcast vs shuffle vs sort-merge
Broadcast hash join copies the small side to every executor and probes it. That is the join you want for a real dimension: customers, accounts, a few million rows, tens of megabytes. Hint it when the planner is shy. Do not hint it when the 'dimension' is last year's 400 GB slowly-changing table. You will broadcast a fact and pin the warehouse.
SELECT /*+ BROADCAST(c) */ o.order_id, c.segment, SUM(o.amount)
FROM analytics.orders o
JOIN analytics.customers c ON o.customer_id = c.customer_id
WHERE o.event_date = CURRENT_DATE()
GROUP BY o.order_id, c.segment;

-- Do not broadcast a 400 GB 'dim':
-- SELECT /*+ BROADCAST(h) */ ... JOIN analytics.orders_history h
Shuffle hash join and sort-merge join move both sides. They are correct for two large inputs, and they are also the DBU event. You make them cheaper by shrinking each side before the join (partition filters, pre-aggregations) and by clustering so files on each side are already somewhat local to the key: that helps scans more than it reorganizes a shuffle, but it still cuts the bytes that enter the exchange.
Nested-loop joins still happen, usually because of a non-equality condition or a CROSS JOIN that Looker emitted. They are rare in well-reviewed SQL, expensive when a BI tool improvises. If you see them in the Spark UI, fix the join predicate before you buy size.
Runtime stats beat hints, until they do not. AQE may broadcast a side that was estimated huge and turned out tiny, or it may not, if stats are stale or the side really is huge. A /*+ BROADCAST(c) */ on a true dimension documents intent. A broadcast hint on a table that is sometimes 20 MB and sometimes 20 GB is risky, since it disables that adaptive check. Split those tables.
Choosing a join strategy by build-side size
A small dimension can be copied to every executor. Two large facts cannot, so their rows must shuffle across the network to find matches.
Rewrite the join the engine can actually skip
Filter on the partition column first so each side is a day, not 8 TB. Broadcast the dimension explicitly if it is small. Liquid-cluster or ZORDER the fact on the join key if this join is the expensive job. Materialize a daily mart so Looker does not re-shuffle the same two facts 40 times.
SELECT /*+ BROADCAST(c) */ o.order_id, c.segment, SUM(o.amount)
FROM analytics.orders o
JOIN analytics.customers c ON o.customer_id = c.customer_id
WHERE o.event_date = CURRENT_DATE()
GROUP BY o.order_id, c.segment;
-- event_date prunes files. Broadcast avoids shuffling customers.
-- Cluster orders by customer_id if this join is the daily bill.
Predicate pushdown into both sides of the join is the cheapest rewrite. WHERE o.event_date = CURRENT_DATE() must apply before the join, not after a SELECT star CTE that already shuffled. If the date filter sits on a wrapping query, Photon may shuffle yesterday too. Put the prune in the innermost reads.
Pre-aggregate before you join when the dashboard wants a grain coarser than the fact. Summing 2 TB of order lines down to account-day first, then joining customers, shuffles a small aggregate instead of the lines. This is boring dimensional modeling. It is also the usual 10x.
WITH daily AS (
  SELECT event_date, customer_id, SUM(amount) AS amount
  FROM analytics.orders
  WHERE event_date = CURRENT_DATE()
  GROUP BY 1, 2
)
SELECT /*+ BROADCAST(c) */ d.customer_id, c.segment, d.amount
FROM daily d
JOIN analytics.customers c ON d.customer_id = c.customer_id;
Collocating two facts on the same join key with liquid clustering does not make Databricks a shared-nothing sort-merge that avoids the network. Treat clustering as a scan win that also makes shuffle inputs smaller, not as a promise that the exchange disappears. If the join is daily and identical, materialize it.
The fix stack for a repeated shuffle join
Each layer removes bytes before the exchange. Filtering first and materializing last turns a daily shuffle into a one-time ETL cost.
AQE helps at the edges; it cannot invent a clustered key
spark.sql.adaptive.enabled is on by default in current Databricks runtimes. AQE can switch join strategies, coalesce shuffle partitions, and handle skew by splitting fat partitions. Those are real wins on messy data, but none of them is a substitute for a clustering key, a partition filter, or a mart.
-- Session / warehouse: adaptive execution should stay on.
SET spark.sql.adaptive.enabled = true;
SET spark.sql.adaptive.coalescePartitions.enabled = true;
SET spark.sql.adaptive.skewJoin.enabled = true;

-- These do not replace:
-- WHERE event_date = CURRENT_DATE()
-- CLUSTER BY (customer_id)
-- CREATE TABLE analytics.orders_daily_mart …
Skew handling is the AQE feature people cite after a 12-minute join. One customer_id with 12 percent of orders will still dominate a shuffle. AQE can split that partition. It cannot make the key less skewed. If the business is one retail giant plus a long tail, pre-aggregate or isolate the giant. Do not keep buying warehouse size for a known hot key.
Empty partition coalescing stops you from launching thousands of tiny shuffle tasks after a selective filter. That is latency and overhead, which is DBU-adjacent. It will not turn a 2 TB shuffle into a broadcast. If you disabled AQE years ago on a classic cluster and never revisited it, turn it back on, re-measure, and still fix the join.
Hints fight AQE when they are wrong. A BROADCAST hint on a huge side disables the adaptive escape hatch. Use hints for stable dimensions. Let AQE work on everything else. If you need a hint on a fact, the model is wrong.
Skew, spill, and shuffle partitions
Spill is the shuffle that missed memory. spilled_local_bytes, when the channel logs it, should be near zero on a healthy warehouse size for that query. Persistent spill on a repeated fingerprint is either a size problem or a join problem. Try a pre-aggregate and a partition filter before you jump 2X-Large. Size is the expensive experiment.
SELECT
  LEFT(statement_text, 160) AS statement_head,
  COUNT(*) AS runs,
  SUM(total_duration_ms) AS duration_ms,
  SUM(read_bytes) AS bytes,
  SUM(COALESCE(spilled_local_bytes, 0)) AS spilled_bytes
FROM system.query.history
WHERE start_time >= CURRENT_DATE() - INTERVAL 30 DAYS
  AND execution_status = 'FINISHED'
  AND statement_text ILIKE '% JOIN %'
GROUP BY 1
ORDER BY duration_ms DESC
LIMIT 40;
-- High duration + spill on a repeated JOIN is the shuffle finding.
-- Fail soft if spilled_local_bytes is absent.
spark.sql.shuffle.partitions defaults that made sense on a 200 GB cluster will launch too many tiny tasks or too few fat ones on a 8 TB join. AQE coalescing reduces the tiny-task case. The fat-task case is skew or too little parallelism. Do not copy a hive-era 200 shuffle partitions into a serverless SQL warehouse and call it tuning.
Photon off versus Photon on is a valid A/B for a fingerprint, because some expressions still fall back and some joins change shape. Run the same SQL both ways on a warehouse you can afford to test. If Photon is off for a historical reason, you may be shuffling in slower code for free. If Photon is on and shuffle bytes are still huge, Photon is not the bug.
Explain and the Spark UI are how a human confirms shuffle. system.query.history is how you find which fingerprints deserve that hour. Do not start in the UI. Start in 30 days of history ranked by duration times runs. Then EXPLAIN the winner. SlashPeak will start in history too, and will never need the Spark UI attached to your cluster.
Repeated shuffle is a fingerprint, not 40 incidents
The same Looker explore at 9am is one pattern. Fingerprint query text (PII-safe) and multiply duration times DBU rate times runs per month. That is the finding. Fix the explore or the mart once.
Literals make fingerprints lie. A date parameter that changes every day is still the same explore. Strip literals, normalize whitespace, and hash. If you group by raw statement_text you will see 30 findings of one run each and miss the monthly DBU pile.
Client application plus executed_by tells you whether to change a Looker explore, a dbt model, or a notebook someone scheduled by accident. Notebooks that shuffle two facts every hour because a widget default is yesterday are pipelines. Treat them as pipelines. Move them to jobs compute and materialize the output.
Caching at the BI layer can hide a shuffle from users and still bill it on every cache miss. Looker PDT, Tableau extract, or a Databricks materialized view are the honest caches because they have an owner and a schedule. A result cache on the warehouse that expires every time the table ticks is not a mart.
Materialize a mart so Looker does not re-shuffle
If the join is the product (orders plus segment plus today's amounts), write that table once. Partition it by event_date, cluster it by the dashboard filters, and point the explore at the mart. The shuffle still happens, but it happens in ETL, once, on jobs compute, where you can size it without leaving a Large SQL warehouse up for BI tails.
CREATE TABLE IF NOT EXISTS analytics.orders_daily_mart (
  event_date DATE,
  customer_id STRING,
  segment STRING,
  amount DECIMAL(18, 2)
)
USING DELTA
PARTITIONED BY (event_date);

INSERT INTO analytics.orders_daily_mart
REPLACE WHERE event_date = CURRENT_DATE()
SELECT /*+ BROADCAST(c) */
  o.event_date,
  o.customer_id,
  c.segment,
  SUM(o.amount) AS amount
FROM analytics.orders o
JOIN analytics.customers c ON o.customer_id = c.customer_id
WHERE o.event_date = CURRENT_DATE()
GROUP BY 1, 2, 3;
Materialized views in Databricks can serve the same role for stable aggregations. They are not a free pass for a 400-line explore that changes every filter. Use them when the grain is stable and the filter is a partition column. Use a table when the business wants yesterday's close frozen.
Do not materialize everything. A mart for every explore is a copy farm. Materialize fingerprints that are shuffle-heavy, frequent, and stable. query.history is how you know. A weekly review of the top 20 join fingerprints is a better mart backlog than a modeling workshop with no metrics.
After the mart exists, confirm the explore actually uses it. History will tell you if the old two-fact join is still running, and dashboards that were supposed to migrate are the usual leak. The real finding is not that a mart got built; it is that this fingerprint's run count fell.
Plan metrics without reading the table
system.query.history already has duration, bytes_read, rows, and often shuffle or spill profile counters depending on the channel. That is enough to rank shuffle-heavy repeated jobs. Table contents are not required.
EXPLAIN is allowed in your workspace and still not required for a scanner. A recommend-only product can say: this fingerprint is JOIN-shaped, duration is high, bytes are high, spill is high, it runs 40 times a day on warehouse Large. Here is the rewrite pattern. You run EXPLAIN if you want the operator names.
Missing profile data is not a license to guess. If spill and shuffle columns are null, SlashPeak will keep the finding advisory or skip it. The BigQuery cousin of this rule already refuses to invent a partition miss without job_stages. Databricks will get the same conservatism.
Avoid selecting from the joined tables just to see if the key is skewed. Skew shows up in duration, spill, and, if you must, a job you run yourself on aggregated counts. A SaaS scanner that asks for SELECT on user catalogs is working from a different trust model than this one.
Takeaways
- Photon does not make a shuffle of two unclustered facts cheap. AQE helps at the edges.
- Broadcast real dimensions. Do not broadcast a second fact. Nested-loop and CROSS JOIN from BI tools are their own incident.
- Partition the date on both reads, pre-aggregate before the join, cluster the join key, or materialize a mart.
- Spill and wait columns tell you whether to rewrite SQL or change warehouse size. Do not start with 2X-Large.
- Repeated shuffle is one fingerprint times runs times DBU rate, not 40 tickets. Strip literals before you group.
- A mart that nobody routes explores onto has not fixed anything. query.history run counts are the real migration test.
- SlashPeak will rank heavy repeated jobs by fingerprint the same way it ranks repeated BigQuery queries (coming soon, system tables only, recommend-only).